Bootstrapping My Embedded Rust Development Environment
After watching James Munns' Something for Nothing talk at RustConf about all of the cool things in the embedded Rust world that have been going on, I decided to take a crack at some embedded work. I built an ErgoDox a while back and already had some basic understanding of how its keyboard controller operates, so I thought "why not design my own keyboard?"
Disclaimer: I'm mostly a newbie at embedded development short of a few classes I took back in college that mostly involved developing for the 68HC11 and 6800, both of which were released in the 80's. Yikes. Anyway, take all of this with a grain of salt! 🙂
Selecting A Controller
Having worked with the Teensy 2.0 for my ErgoDox, I originally planned to use the ARM-based Teensy LC for my controller. Since there wasn't much in the way of device or board support for it in the embedded rust world, I went down the rabbit hole of building it mostly from the ground up.
I got as far as generating the device
crate via
svd2rust and started on the
board support crate before
hitting a snag. I disregarded this bit in the example memory.x from the Rust Embedded Book:
/* You can use this symbol to customize the location of the .text section */
/* If omitted the .text section will be placed right after the .vector_table
   section */
/* This is required only on microcontrollers that store some configuration right
   after the vector table */
/* _stext = ORIGIN(FLASH) + 0x400; */
Everything looked to be going alright - I had a basic "blink" program that
I could build and load that seemed to work for the most part, but then I
decided to add an interrupt handler. This was apparently enough to brick my
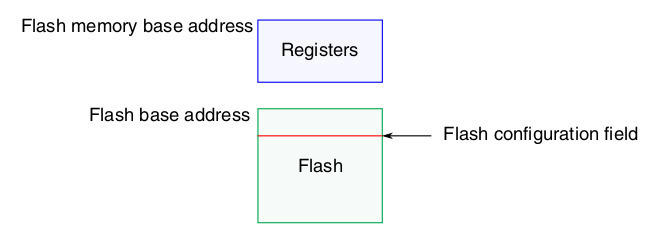
Teensy. The chip on the Teensy-LC, the MKL26Z64VFT4, has a small flash-config
section inside the main flash region of memory, which is what the comment in
the memory.x example alluded to.
As far as I could tell, I managed to either load some bad data into that region when flashing my board (which the teensy bootloader is supposed to prevent), my running code somehow managed to touch it, or something else entirely went wrong. At any rate, my first Teensy-LC stopped showing up as a USB device even when the reset button was pressed. As a part of my debugging process, I flashed the same program to my second Teensy-LC to make sure that it was in fact my program that had killed it and not some other electrical issue I may have induced. Turns out I was right, and both boards were now inoperable. Whoops.

I created a thread on the PJRC forum in hopes that someone would have some ideas for me, or perhaps some replacement boards since, from what I gathered, it wasn't supposed to be possible to brick them in this manner. Alas, no replies.
Designing for Debuggability
One of the major failings of the Teensy family is their lack of an accessible hardware debugging interface. While the core microcontroller technically has a debugging interface, it's "hijacked" by the bootloader/flasher coprocessor, making it unusable without some hacking that I didn't feel up for, especially since I had already killed two boards. I suspect that if I had a real debugging interface to connect to, I might have been able to recover them, but since the proprietary incommunicado bootloader was the only way to program them, I was out of luck.
I'd always heard great things about the STM32 family and their debuggability, in addition to pre-existing Rust support, so I went looking for a suitable board in that vein. I pretty quickly found the stm32duino wiki and their list of STM32F103 boards. The RobotDyn "Black Pill" seemed like it would do the trick, so I grabbed 5 of them from their site.
Running Some Code
A simple "blink" program is usually a good first pass at any embedded development target. I've been using the one from the stm32f103xx-hal crate. The setup of the Rust project is covered pretty thoroughly in the Embedded Book, so I won't go into much detail on it here.
The STM32 family comes with their own built-in bootloader that supports flashing over pretty much any serial peripheral, such as I2C or UART. I happened to have one of these USB to TTL cables laying around, so that made flashing the boards pretty straightforward.
In the above video, RX and TX are connected to PA9 and PA10 respectively and
3v3/GND to their respective pins. With that set up, the blink program
can be flashed with stm32flash:
)
)
)
)
For this, the BOOT0 pin (closest to the USB port) needs to be jumpered high when the board is powered up. This puts the device into bootloader mode. In order to actually run the code, the board needs to be started with BOOT0 jumpered low. This is obviously a bit of a pain when trying to iterate quickly. Luckily, it's not (usually) necessary when you have a real debugger.
Building The Debugger
Running code is fun and all, but what I really wanted was a way to debug it. Enter Black Magic Probe.
Black Magic Probe is an open-source on-chip-debugger that runs its own GDB server, so it doesn't require any additional tooling on the host side. It runs on quite a few platforms and can target many common Cortex-M and Cortex-A controllers.
Since I got several of the RobotDyn boards, I figured I could spare one for a debugging platform. Building BMP for it was fairly straightforward:
&&
This gave me both src/blackmagic_dfu.bin and src/blackmagic.bin. The DFU
binary is a bootloader that allows upgrading the probe over USB rather than
having to break out the USB-TTL cable every time. As with the blink program,
flashing it was as easy as
)
Again, BOOT0 must be jumpered high for this.
From there, everything else could be done over USB with BOOT0 held low!
An interesting quirk of the STM32F103C8 chips is that, while they're only
declared to have 64KB of flash, nearly all of them in reality have
128KB.
This isn't guaranteed, YMMV, etc., but for my purposes, this is great news,
considering that BMP takes more than 64KB. dfu-util, unfortunately, will
respect the announced 64KB limit and will refuse to flash the
blackmagic.bin.
Fortunately, there's a script in the BMP project
(scripts/stm32_mem.py) that disregards the announced memory.
)
)
Now we have a fully functional BMP debugger!
Debugging Some Code
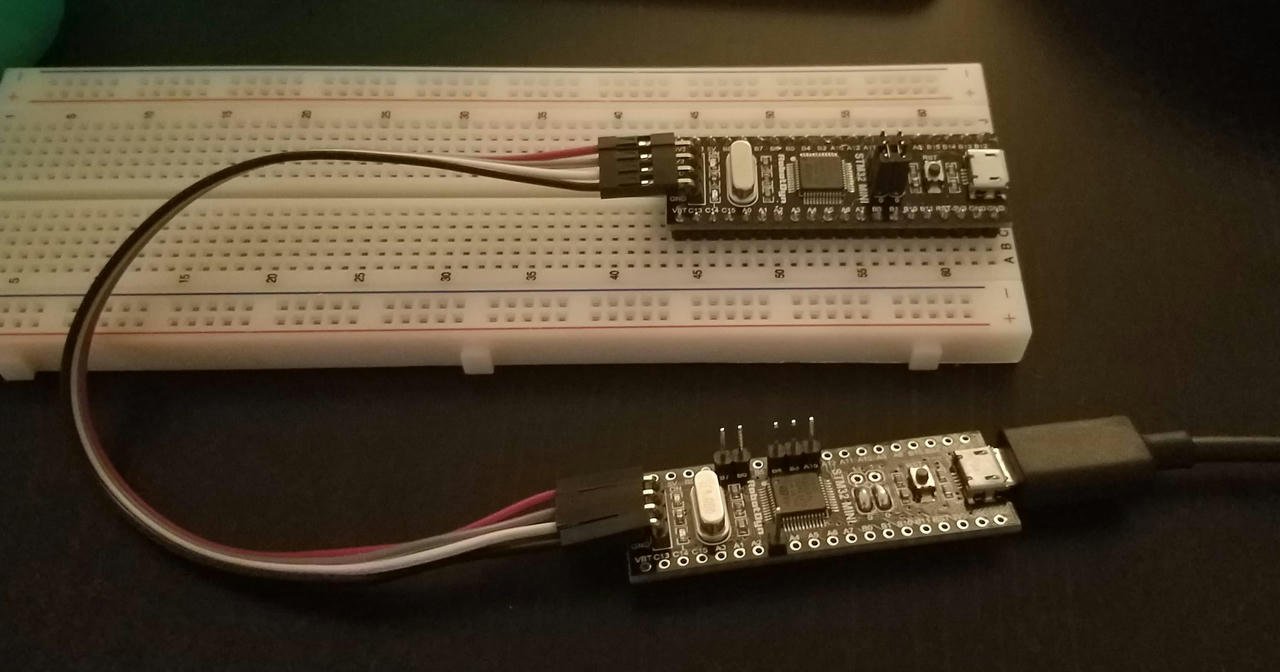
Now the real fun begins. The BMP reuses the SWD pins at the opposite side of the board form the USB port for its own connection to targets that are begin debugged. This makes connecting everything fairly straightforward. SWDIO to SWDIO, SWCLK to SWCLK, etc. Since the BMP provides power to the target, no additional connections are strictly necessary aside from Host USB->BMP and BMP->Target SWD.

In this picture, my debugger is the one without the full headers and with the boot pins pulled permanently low.
When the BMP is plugged into the host computer, it shows up as two CDC ACM devices - effectively two serial devices. The first is the debugging interface and the second is its USB->Serial adapter. We're just going to worry about the debugger for now.
The debugger runs its own GDB server, so attaching to it only requires the appropriate GDB.
()
And now we're connected to the BMP! Attaching to the target is equally simple:
()
()
)
)Note that it pauses whatever is currently running on the target. Since it's the program that I'd loaded previously, I get source/line information, but you may not if you haven't loaded anything yet, or if the code on the controller differs from the binary you're using.
Loading new code onto it is also easy:
()
And then, of course, running!
()
)
Interrupting the program and adding breakpoints all work pretty much as expected, which blew my mind!
break main.rs:42
Breakpoint 1 at 0x800028a: file src/main.rs, line 42.
cont
Continuing.
Note: automatically using hardware breakpoints for read-only addresses.
Breakpoint 1, main at src/main.rs:42
42 led.set_high;
list
37 let mut led = gpioc.pc13.into_push_pull_output;
38 // Try a different timer (even SYST)
39 let mut timer = syst;
40 loop
46 }
info locals
timer = # edited for brevity
led = # edited for brevity
gpioc =
clocks = # edited for brevity
rcc = # edited for brevity
flash =
dp =
cp =
This can be integrated into the Cargo workflow via the .cargo/config:
[]
= "arm-none-eabi-gdb -q -x bmp-connect.gdb -ex run"
bmp-connect.gdb:
target extended-remote /dev/ttyACM0
monitor swdp_scan
attach 1

set print asm-demangle on

break DefaultHandler
break UserHardFault
break rust_begin_unwind

load
and then the program can be flashed and executed with just cargo run!
IDE Integration
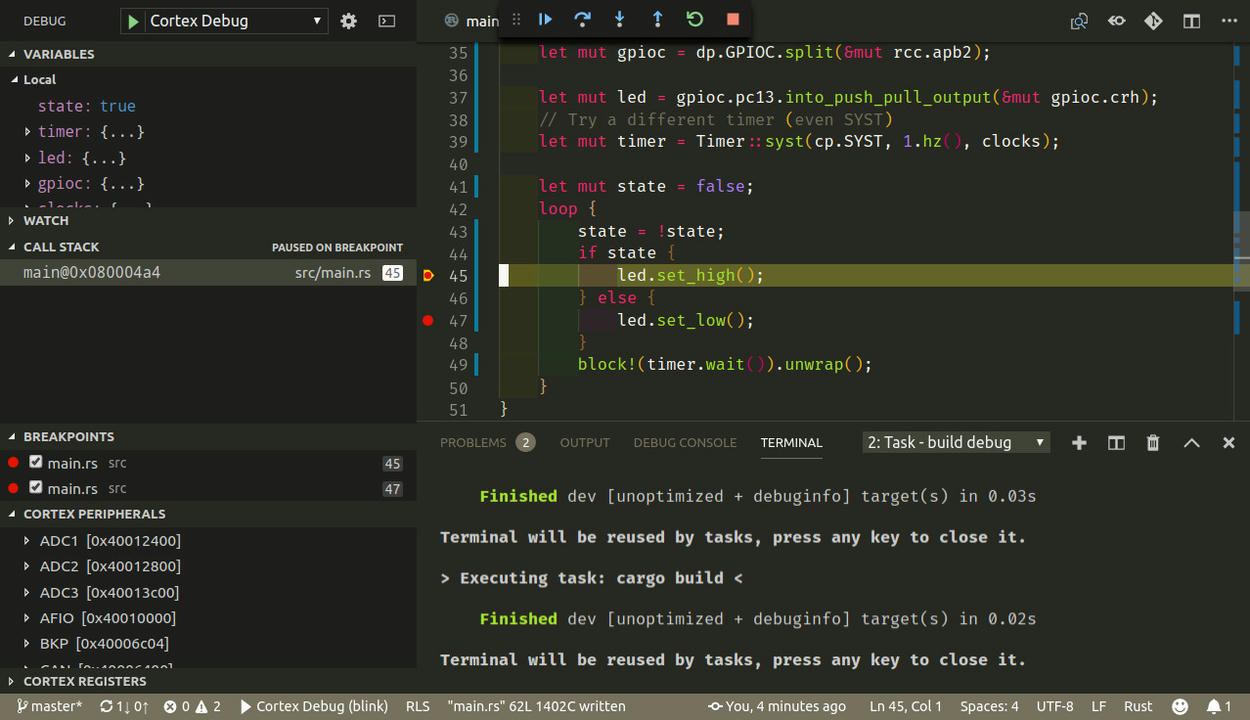
Debugging via the GDB cli is cool, but I wanted to take it a step further and
get it all working through my IDE, VSCode. Luckily, there's an extension that
makes it pretty trivial - Cortex
Debug. After installing it, an entry
in the launch.json can be created:
Some things to note here are my "preLaunchTask" which runs a debug build task defined as:
and also the "device" entry, which allows the debugger to display the device peripherals.
With this, everything "Just Works!"
